-
Revenue from sales and services

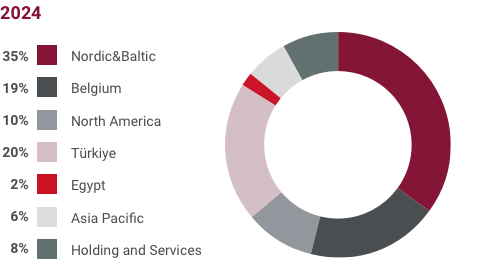
[Euro ‘000] 2025
(Non-GAAP)2024
(Non-GAAP)Change % Nordic & Baltic 638,311 623,338 2.4% Belgium 322,438 335,314 -3.8% North America 176,652 182,703 -3.3% Türkiye 341,564 353,535 -3.4% Egypt 48,022 46,264 3.8% Asia Pacific 98,813 104,537 -5.5% Holding and Services 174,605 148,596 -17.5% Eliminations (156,431) (145,448) 7.6% Total revenue from sales and services 1,643,974 1,648,839 -0.3% -
EBITDA


[Euro ‘000] 2025
(Non-GAAP)2024
(Non-GAAP)Change % Nordic & Baltic 181,811 173,716 4.7% Belgium1 120,947 93,942 28.7% North America 23,760 24,774 -4.1% Türkiye2 93,543 78,999 18.4% Egypt 8,770 16,874 -48.0% Asia Pacific 17,960 21,240 -15.4% Holding and Services3 13,384 (10,289) -230.1% Total EBITDA 460,175 399,256 15.3% 1Includes non-recurring income of EUR 17 million in 2025.
2Includes non-recurring income of EUR 20.3 million in 2025 and EUR 6.9 million in 2024, the latter being neutral on the consolidated result.
3Includes non-recurring income of EUR 14.7 million in 2025 and non-recurring charges of EUR 11 million in 2024, of which EUR 6.9 million are neutral on the consolidated result.
Last update: